| The Michaelis-Menten equation: a simple model of an enzymatic reaction
|
| Enzyme reactions are multistep in nature and comprise several partial reactions. In 1913, long before the structure of proteins was known, Michaelis and Menten developed a simple model for examining the kinetics of enzyme-catalyzed reactions (Fig. 5.4). The Michaelis-Menten model assumes that the substrate S binds to the enzyme E, forming an essential intermediate, the enzyme-substrate complex (ES), which then undergoes reaction on the enzyme surface and decomposes to E + product (P). The model assumes that E, S, and ES are all in rapid equilibrium with one another, so that a steady concentration of ES is rapidly achieved, and that decomposition of the ES complex to E + P is the rate-limiting step in catalysis.
|
| ISOZYMES: GLUCOKINASE AND HEXOKINASE |
Hexokinase catalyzes the first step in glucose metabolism in all cells, namely the phosphorylation reaction of glucose by adenosine triphosphate (ATP) to form glucose 6-phosphate (Glc-6-P): metabolism in all cells, namely the phosphorylation reaction of glucose by adenosine triphosphate (ATP) to form glucose 6-phosphate (Glc-6-P):
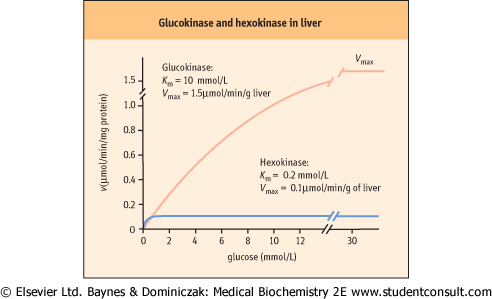
 This enzyme has a low Km for glucose (0.2 mmol/L) and is inhibited allosterically by its product, Glc-6-P. Since normal glucose levels in blood are about 5 mmol/L and intracellular levels are 0.2-2 mmol/L, hexokinase efficiently catalyzes this reaction under normal conditions, e.g. in muscle.
 |
| Hepatocytes, which store glucose as glycogen, and pancreatic β-cells, which regulate glucose consumption in tissues and its storage in liver by secreting insulin, contain an isozyme called glucokinase. Glucokinase catalyzes the same reaction as hexokinase, but has a higher Km for glucose (10 mmol/L) and is not inhibited by the product, Glc-6-P. Since glucokinase has a much higher Km than hexokinase, glucokinase phosphorylates glucose with increasing efficiency as blood glucose levels increase following a meal (see Fig. 5.4). One of the physiologic roles of glucokinase in the liver is to provide Glc-6-P for the synthesis of glycogen, a storage form of glucose. In the pancreatic beta cell, glucokinase functions as the glucose sensor, determining the threshold for insulin secretion. Mice lacking glucokinase in the pancreatic β-cell die within 3 days of birth of profound hyperglycemia, because of failure to secrete insulin. |
| Figure 5.4 Properties of glucokinase and hexokinase. Glucokinase and hexokinase catalyze the same reaction, phosphorylation of glucose to glucose 6-phosphate (Glc-6-P). They exhibit different kinetic properties and have different tissue distribution and physiologic function. |
The catalytic constant, kcat, also known as the turnover number, is defined as the number of substrate molecules that can be converted per enzyme molecule per unit time. The proportion of ES, in relation to the total number of enzyme
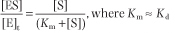
molecules [E]t, i.e. the ratio [ES]/[E]t, limits the velocity of an enzyme (v) so that:
 Since E, S, and ES are all in chemical equilibrium, the enzyme achieves maximal velocity, Vmax, at very high (saturating) substrate concentrations [S], when [ES] ≈ [E]t.
|
| page 55 |  | | page 56 |
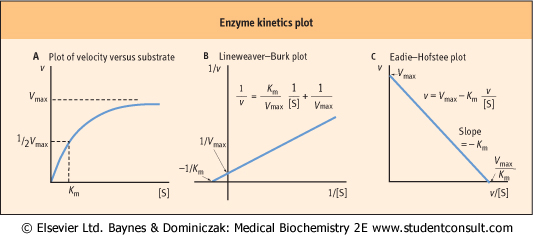
| Figure 5.5 Enzyme kinetics plot. Kinetic representations of the properties of enzymes. (A) Michaelis-Menten plot of velocity (v) versus substrate concentration ([S]); (B) Lineweaver-Burk plot; and (C) Eadie-Hofstee plot. |
For the dissociation of the ES complex, the law of mass action yields
 Given that
 it can be shown that
 Consequently, v is given by
 Since kcat [E]t corresponds to the maximum velocity, Vmax, that is attained at high (saturating) substrate concentrations, we obtain the Michaelis-Menten equation:
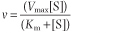 Analysis of the above equations indicates that the Michaelis constant, Km, is expressed in units of concentration and corresponds to the substrate concentration at which v is 50% of the maximum velocity, i.e. [ES] = ½ [E]t and v = Vmax/2.
|
The Michaelis-Menten model is based on the assumptions that:
- E, S, and ES are in rapid equilibrium
- there are no forms of the enzyme present other than E and ES
- the conversion of ES into E + P is a rate-limiting, irreversible step.
|
| Similar types of kinetic models have been developed for describing the kinetics of multisubstrate, multiproduct enzymes.
|
| Use of the Lineweaver-Burk and Eadie-Hofstee plots for estimating Km and Vmax
|
| In a plot of reaction rate versus substrate concentration, the rate of the reaction approaches the maximum velocity (Vmax) asymptotically (Fig. 5.5A), so that it is difficult to obtain accurate values for Vmax, and, as a result, Km (substrate concentration required for half-maximal activity), by simple extrapolation. To solve this problem, several linear transformations of the Michaelis-Menten equation have been developed.
|
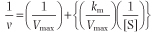
The Lineweaver-Burk, or double reciprocal, plot is obtained by taking the reciprocal of the steady-state Michaelis-Menten equation (Fig. 5.5B). By rearranging the equation, we obtain:
|
| MEASUREMENT OF ENZYME ACTIVITY IN CLINICAL SAMPLES |
| In clinical laboratories, enzyme activity is measured in the presence of saturating substrate(s) and coenzyme concentrations. Initial kinetics are normally recorded to minimize reverse reactions, i.e. conversion of product to substrate in reversible reactions. Under these conditions (v ≈ Vmax), enzyme activity is directly proportional to enzyme concentration. Enzyme activity is expressed in IU/mL of plasma, serum, cerebrospinal fluid, etc. For interlaboratory comparisons, the conditions for the enzyme assay must be standardized, e.g. the substrate and coenzyme concentrations used, the buffer, buffer concentration, ionic species and ionic strength, pH and temperature. Most clinical samples are collected under fasting conditions; this assures consistency in measurement of analytes whose concentration may vary diurnally or others, such as glucose or lipids, that vary in response to food intake. Lipemic samples are cloudy and may yield unreliable data by spectrophotometric or fluorometric methods. To avoid such problems, clinical samples must be delipidated, commonly by extraction with organic solvent. |
| This equation yields a straight line (y = mx + b), with y = 1/v, x = 1/[S], m = slope, b = y intercept. Therefore, a graph of 1/v versus 1/[S] (Fig. 5.5B) has a slope of Km/Vmax, a 1/v intercept of 1/Vmax, and a 1/[S] intercept of -1/Km. Although
the Lineweaver-Burk plot is widely used for kinetic analysis of enzyme reactions, because reciprocals of the data are calculated, a small experimental error, especially at low substrate concentration, can result in a large error in the graphically determined values of Km and Vmax. An additional disadvantage is that important data obtained at high substrate concentrations are concentrated into a narrow region near the 1/v axis.
|
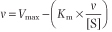
A second, widely used linear form of the Michaelis-Menten equation is the Eadie-Hofstee plot (Fig. 5.5C). This is described by the equation:
|
| page 56 | | | page 57 |
| TREATMENT WITH AN INHIBITOR OF ANGIOTENSIN-CONVERTING ENZYME (ACE) |
| A 50-year-old man was admitted to hospital suffering from general fatigue, a stiff shoulder, and headache. The patient was 1.8 m tall and weighed 84 kg. His blood pressure was 196/98 mmHg (normal below 140/90 mmHg; optimal below 120/80 mmHg) and his pulse was 74. He was diagnosed as hypertensive. The patient was given captopril, an angiotensin converting enzyme (ACE) inhibitor. After 5 days' treatment, his blood pressure returned to near-normal levels. |
| Comment. Renin in the kidney converts angiotensinogen into angiotensin I, which is then proteolytically cleaved to angiotensin II by ACE. Angiotensin II increases renal fluid and electrolyte retention, contributing to hypertension. Inhibition of ACE activity is therefore an important target for hypertension treatment. Captopril inhibits ACE competitively, decreasing blood pressure. (See also Chapter 22.) |
| In this case, a plot of v versus v/[S] has a y axis (v-intercept) of Vmax, an x axis (v/[S]) intercept of Vmax/Km, and a slope of -Km. The Eadie-Hofstee plot involves only one reciprocal and does not compress the data at high substrate concentrations.
|
|