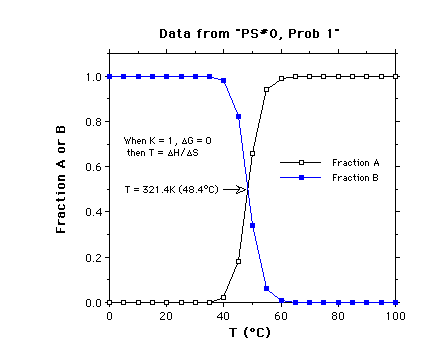
1. The graph shown below was made by calculating the fractions of A and B at temperatures in the range from 0-100 °C. These calculations were done on the Excel spreadsheet that is in the Adv. Biochem. server. Next, the table of calculated values was copied and pasted into a Cricket Graph file; these were then used to make the graph. The graph was converted to a GIF file so that Netscape could display it here.
2. A page related to this problem on the topic of
first-order decay shows standard ways of analyzing and displaying experimental data.
Take the Amino Acid Structure Quizzes from links on this page: Molecular Models for Biochemistry at Carnegie
Mellon. ![]() Return to ABC98 Home Page
Return to ABC98 Home Page