In 1988, the Department purchased a diskless Perkin Elmer 1605 FTIR. To help in the process of being able to store the IR spectra recorded, two programs were written. The first to capture the files via the serial port (RS-232) and the second to display the data.
For information on the first program, FTtoPC, and other DOS utilities to convert files obtained from various instruments to JCAMP-DX format, see our JCAMP-DX utility page.
The original display program has now been totally rewritten and the code licensed to MDL for incorporation into their plugin CHIME. Version 2 was released in late 1998 and is available from the MDL web site.
(We no longer offer the NPJDX.DLL plugin or 32-bit application JCAMPVW.EXE from the web site here, but will instead be involved in upgrades to the CHIME plugin.)
A condition of our contract is that a free version for student and academic use will always be available from MDL.
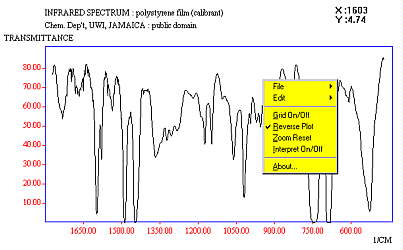
As before, the plugin decodes the information in the .(J)DX file from your instrument and displays an XY plot. The decompressed data can then be stored in an ASCII text file containing 2 columns (X and Y values) which allows moving to a spreadsheet file for further analysis, e.g. comparison of 2 samples, or more elaborate plotting.
In some of the demonstration and examples we show the use of links between spectra and molecular graphics display such that clicking on peaks in a Mass Spectrum will highlight the relevant FRAGMENTS in the molecule, clicking on peaks in the IR spectrum will highlight the relevant BONDS and clicking on peaks in the NMR will highlight the appropriate protons or carbon atoms. See below for more details on how to set up these links.
With the widespread use of the WWW growing so unbelievably fast, the idea of being able to link not only molecular coordinates via PDB format to a document, but being able to display various types of spectra seemed a wonderful opportunity to enhance the teaching of spectroscopy. To that end, problem sets can be established of known and unknown samples to view. See a makeup demo of how this might look. The possibility of sub-structure searches returning structures and spectra can now be accomplished.
The MIME type posted by the Chemistry server here for JCAMP-DX files is:
	chemical/x-jcamp-dx 	dx,jdx  or
	chemical/jcamp-dx 	dx,jdx
To configure the CHIME plugin, all you need to do is run the installer. To test, try out the demo files or sample testdata files.
The JCAMP-DX data exchange formats and standards are currently the responsibility of the IUPAC Committee on Printed and Electronic Publications (CPEP). The CPEP JCAMP working party is chaired by Antony Davies, ISAS, Germany.
A copy of the following papers is available from the ISAS web site in Adobe Acrobat (PDF) format.
For NMR vs 5.0 Ref. Applied Spectroscopy, 1993, 47, 1093-1099.
for IR vs 4.24 Ref. Pure & Appl. Chem., 1991, 63, 1781-92.
for MS vs 4.24 Ref. Applied Spectroscopy, 1994, 48, 1545-1552.
For an historical account of JCAMP-DX development, see the summary posted on the bionet.structure-nmr news group in January 1996. A local copy has been made available by the author.
The pages on JCAMP-DX by Antony
Davies and Bob McDonald are
essential reading for anyone interested in learning more about the JCAMP-DX
specifications.
(Tony chairs the IUPAC working group on JCAMP-DX and Bob, who is also a member, was
coauthor of the original paper describing JCAMP-DX for IR). Both have provided test data
for downloading from their web sites.
The method of encoding data, relies on substitution of numbers by ASCII characters. The following gives the compression tables used for this purpose.
| Compression Table | ||||||||||
|---|---|---|---|---|---|---|---|---|---|---|
| ASCII digits | 0 | 1 | 2 | 3 | 4 | 5 | 6 | 7 | 8 | 9 |
| Positive SQZ digits | @ | A | B | C | D | E | F | G | H | I |
| Negative SQZ digits | a | b | c | d | e | f | g | h | i | |
| Positive DIF digits | % | J | K | L | M | N | O | P | Q | R |
| Negative DIF digits | j | k | l | m | n | o | p | q | r | |
| Positive DUP digits | S | T | U | V | W | X | Y | Z | s | |
| Compression types handled by CHIME | ||
|---|---|---|
| FIX | e.g. 99 98 97 96 98 93 | fixed format |
| PAC | e.g. 99+98+97+96+98+93 | packed |
| SQZ | e.g. 99I8I7I6I8I3 | simple compression |
| DIF | e.g 99aaaBe | difference |
| DUP | e.g 99aUBe | difference and duplicates |
| TSV | e.g 99TAB98TAB97TAB96TAB98TAB93 | Tab separated values |
| CSV | e.g 99,98,97,96,98,93 | Comma separated values |
A collection of files useful for checking JCAMP-DX programs have been assembled from various sources. Some provide error free information, while others are more of the nature of an "assault course for JCAMP-DX".
The mechanism for creating the links so far is to add new HEADER items to the JCAMP-DX
file. This may eventually change to using a separate file for the interpretation
information.
Two new HEADER items are used, ##$ASSIGNMENT TYPE= and ##$CHIME TARGET= along with the
existing header label ##PEAK ASSIGNMENT=
The first at present only accepts the string CHIME, but in future could be used for calls
to load video or audio files, etc.
The second sets the target, ie defines where the script is to be applied and is the name
given in the embed statement that called the molecular graphics file, in the first example
below this is PROPSTRUCT.
In the present context, ##PEAK ASSIGNMENT has the following syntax:
(X value, Y value, width, <CHIME SCRIPT>)
In the following example the code is for an IR spectrum covering the range 4500 - 400
cm-1.
The last call using the link has been set up such that someone clicking on the spectrum at
a position not covered by one of the previous LINKs will reset the display.
##$ASSIGNMENT TYPE= CHIME
##$CHIME TARGET= PROPSTRUCT
##PEAK ASSIGNMENT= (XYWA)
(3400, 25, 200, <select *; spacefill off; wireframe on; color bonds none;
color atoms cpk; set bondmode and; select within(1.2,atomno=21) or
within(1.2,atomno=22) or within(1.2,atomno=17) or within(1.2,atomno=16) or
within(1.2,atomno=11) or within(1.2,atomno=12); wireframe 60; color bonds
yellow>)
(2960, 40, 40, <select *; spacefill off; wireframe on; color bonds none;
color atoms cpk; set bondmode and; select atomno=20 or atomno=41 or atomno=10
or atomno=43 or atomno=15 or atomno=42; wireframe 60; color bonds yellow> )
(2400, -1, 2000, <select *; spacefill off; wireframe on; color bonds none;
color atoms cpk>)
The selection of atoms e.g select atomno=20 or atomno=41 etc. requires that you know the identity of each bond that is responsible for the absorption in the spectrum.
For IR spectroscopy, it has been suggested that rather than highlighting bonds it would be much better to link the spectral features to animations that display the bond stretching modes. This has been done for a number of samples by a link from peak positions to .XYZ files. See IR animations.
The appropriate lines in the Header of the JCAMP-DX file would now look something like:
##$ASSIGNMENT TYPE= CHIME
##$CHIME TARGET= CHIMEDISP
##PEAK ASSINGMENT= (XYWA)
(3135, -1, 20, <load "3194.xyz"; select *; wireframe 40; animation on>)
(3094, -1, 20, <load "3094.xyz"; select *; wireframe 40; animation on>)
(2924, -1, 15, <load "3057.xyz"; select *; wireframe 40; animation on>)
(2868, -1, 15, <load "3044.xyz"; select *; wireframe 40; animation on>)
(2730, -1, 20, <load "3043.xyz"; select *; wireframe 40; animation on>)
(1793, -1, 5, <load "1793.xyz"; select *; wireframe 40; animation on>)
(1631, -1, 5, <load "1792.xyz"; select *; wireframe 40; animation on>)
(1450, -1, 25, <load "1447.xyz"; select *; wireframe 40; animation on>)
(1373, -1, 5, <load "1373.xyz"; select *; wireframe 40; animation on>)
(1214, -1, 5, <load "1214.xyz"; select *; wireframe 40; animation on>)
(1119, -1, 5, <load "1119.xyz"; select *; wireframe 40; animation on>)
(1098, -1, 5, <load "1098.xyz"; select *; wireframe 40; animation on>)
(1045, -1, 10, <load "1045.xyz"; select *; wireframe 40; animation on>)
(1016, -1, 5, <load "1016.xyz"; select *; wireframe 40; animation on>)
(792, -1, 20, <load "658.xyz"; select *; wireframe 40; animation on>)
(2400, -1, 2000, <load "xylenep.pdb"; wireframe 40;>)
Some FAQ on scientific data formats (including JCAMP-DX)
have been collated by Ilana Stern and posted at a number of sites.
There are several other data formats commonly found in scientific laboratories such as
NUTS for NMR and netCDF for MS and chromatography.
A company that has for many years specialised in offering not only interfaces to
equipment, but converters between data formats is Galactic Industries Corporation.

Their latest product, GRAMS/32, uses .SPC binary files and a number of sites offer
spectra in this format. In addition to the free viewer from Galactic, try their searchable
database and unknown compound competition.
The following links may be useful for more details of databases and viewers:
Another commercial company that is making a large impact on data visualisation and handling is ACD Labs in Toronto, Ca.

They provide some free software for molecular drawing and spectral handling and their commercial programmes are able to use the drawn structure to predict both proton and carbon NMR spectra as well as physical properties.
ACD LABS Spec Manager will display IR, MS, NMR UV/Vis and allow to you to import and export from a variety of file formats.
Home
Lab Manuals Lectures Software Search Spectra Staff Survey Tutorials Weekly Message MISU Return
to Chemistry, UWI-Mona, Home Page
Return
to Chemistry, UWI-Mona, Home Page
Copyright © 1999 by Robert John Lancashire, all rights reserved.
Created and maintained by Dr. Robert J. Lancashire,Created Oct 1994. Last modified 30th June 1999.
URL http://wwwchem.uwimona.edu.jm:1104/software/jcampdx.html